
Oregon’s vibrant community of REALTORS® comprises over 17,000 community-based professionals who know the real estate industry is a central and irreplaceable component of Oregon’s economy — and that our industry is critical to a strong recovery from the economic fallout of the global COVID-19 pandemic.
As REALTORS® shepherd current and aspiring Oregon homeowners and business owners through tens of thousands of transactions every year, commercial and residential real estate professionals help generate billions of dollars in economic impact for our state. In an effort to measure the magnitude of that economic impact of the tens of thousands of real estate transactions that take place yearly in Oregon, the Oregon Association of REALTORS® (OAR) evaluated the extent of the industry’s contributions to the economy based on residential home sales in 2019.
While the primary focus of this article will be on the impact of residential real estate, commercial real estate activity also plays a crucial role in Oregon’s economy, and the sector’s impact is addressed in a subsequent paragraph. Additionally, we’ll note that local government revenues from real estate-related taxes and fees are, admittedly, tough to quantify. There are 36 counties and 241 municipalities (i.e., cities and towns) in Oregon, and each one has its own unique development code with ordinances governing impact fees (usually called System Development Charges, or SDCs), application and permit fees, construction excise taxes, and document recording fees.
It is also important to keep in mind that numerous special districts exist throughout the state, including school districts, water districts, and parks districts, among others. Homeowners need only take a close look at their property tax statements to understand which special taxing districts their property falls within. While this article will not delve deeply into the full budgetary implications of these various local government fees, such revenues contribute immensely to the growth and sustainability of communities large and small throughout Oregon. Now, on to the numbers.
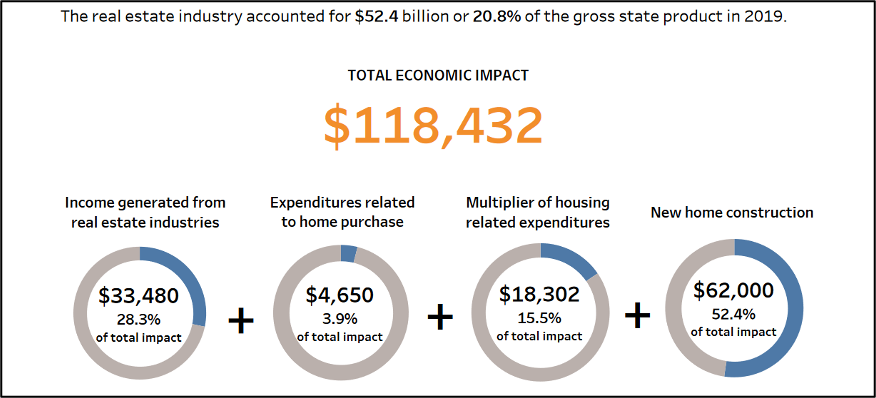
According to the U.S. Bureau of Economic Analysis, Oregon’s 2019 Current-Dollar Gross Domestic Product (GDP) was $251.6 billion. Based on data from the National Association of REALTORS® (NAR) residential real estate industry accounted for approximately $52.4 billion, or 20.8% of Oregon’s GDP in 2019, an increase of $4 billion or 0.5% from 2018.
Additional NAR data tells us approximately 71,100 homes were sold in Oregon throughout the year, an increase of 0.3% from 2018’s estimate of 70,887. And each residential real estate transaction represents $118,432 of total economic impact to the state. This can be broken up into four components:
With respect to the commercial sector, a state-by-state assessment of the economic impact of commercial real estate development, sales, building operations, and property management is assessed annually by the Research Foundation arm of the National Association for Industrial and Office Parks (NAIOP) – the nation’s largest commercial real estate development association. In their 2019 report featuring 2018 data, NAIOP researchers found, across the four commercial real estate segments of office, industrial, warehouse, and retail, that the sector as a whole contributed approximately $4.8 billion in total economic output to the state of Oregon.
As for local government real estate-related revenues, a comprehensive survey of municipal SDCs collected in 2019 was released in February 2020 by the League of Oregon Cities (LOC), the statewide association for Oregon’s 241 towns and cities. LOC’s report noted “striking differences in city SDC implementation,” along geographic and population lines at the local level. As one would expect, the report found that large cities with more new development bring in more SDC revenue and tend to have more complex and established SDC programs. Additionally, their report found that cities throughout Oregon are reducing and waiving SDCs at a higher rate than in previous years in order to pursue goals within adopted affordable housing strategies.
What do all those numbers mean? The real estate industry is a central and irreplaceable component of Oregon’s economy, and not just because of the economic impact of home sales. According to 2019 data from the Oregon Employment Department, the industry employs over 23,000 Oregonians with wages of $1.14 Billion. Property listings, new home construction, and home sales have always been key indicators of economic health, and as Oregon’s population continues to grow over the coming years, additional home construction and sales will continue to add to the strength of the economy.
###
Graph Explanatory Statements:
- $62,000, or 52.4% of the economic impact can be attributed to new home construction. Additional home sales result in additional home production. Generally, one new home is constructed for every six existing home sales, so for every sale of an existing home, 1/6 of a new home’s value is added to the economy.
- $33,480 in income was generated from a typical home sale in 2019 – 28.3% of the total impact. For the purposes of this report, it is assumed that commissions, fees and moving expenses, and income to real estate industry professionals associated directly with a typical Oregon home sale are about 9% of the median home price.
- $18,302, or 15.5% of the economic impact can be credited to a multiplier effect attributable to housing related expenditures. The multiplier effect accounts for the fact that income earned in other sectors of the economy as a result of a home sale is then recirculated into the economy.
- $4,650 in expenditures related to a home purchase – 3.9% of the total impact. Furniture sales and remodeling expenses are approximately $4,650 per home sale, based on data available from the National Association of Home Builders.
Sources:
LOC Data on SDCs https://www.orcities.org/application/files/2615/8170/9849/SDCSurveyReport2-13-20.pdf
US Bureau of Economic Analysis data: https://www.bea.gov/system/files/2020-04/qgdpstate0420.pdf
NAIOP 2019 Commercial RE report: https://www.naiop.org/en/Research-and-Publications/Economic-Impacts-of-CRE/Economic-Impacts-of-Commercial-Real-Estate-2019
Also referenced:
US Census data
PSU population research division statistics
Qualityinfo.org – Oregon economic information including real estate industry profile.